If you are looking to buy a house, you have likely observed that the real estate market is very competitive, with increased bidding activity leading to higher prices. One reason that the real estate market is so hot is that there is very low housing inventory available. This blog post will explore exactly how much lower the housing market inventory currently is in the US when compared to recent years.
This week, Realtor.com published data![]() for its residential listings database as of May 2021, which provides insight into “market trends and monthly statistics on active for-sale.” Realtor.com states the active listing count tracks the number of for-sale properties on the market, excluding pending listings where a pending status is available. Analysis of this data shows that there were 504,436 housing units available for sale in the United States. This number represents a 59.0%, or 725,751 unit, decrease when compared to the average at this same time of the year for the previous four years. The listing of housing inventory is cyclical, with the peak selling season typically occurring between March and September each year. The graph below shows the active listings of residential homes from 7/2016 to 5/2021.
for its residential listings database as of May 2021, which provides insight into “market trends and monthly statistics on active for-sale.” Realtor.com states the active listing count tracks the number of for-sale properties on the market, excluding pending listings where a pending status is available. Analysis of this data shows that there were 504,436 housing units available for sale in the United States. This number represents a 59.0%, or 725,751 unit, decrease when compared to the average at this same time of the year for the previous four years. The listing of housing inventory is cyclical, with the peak selling season typically occurring between March and September each year. The graph below shows the active listings of residential homes from 7/2016 to 5/2021.
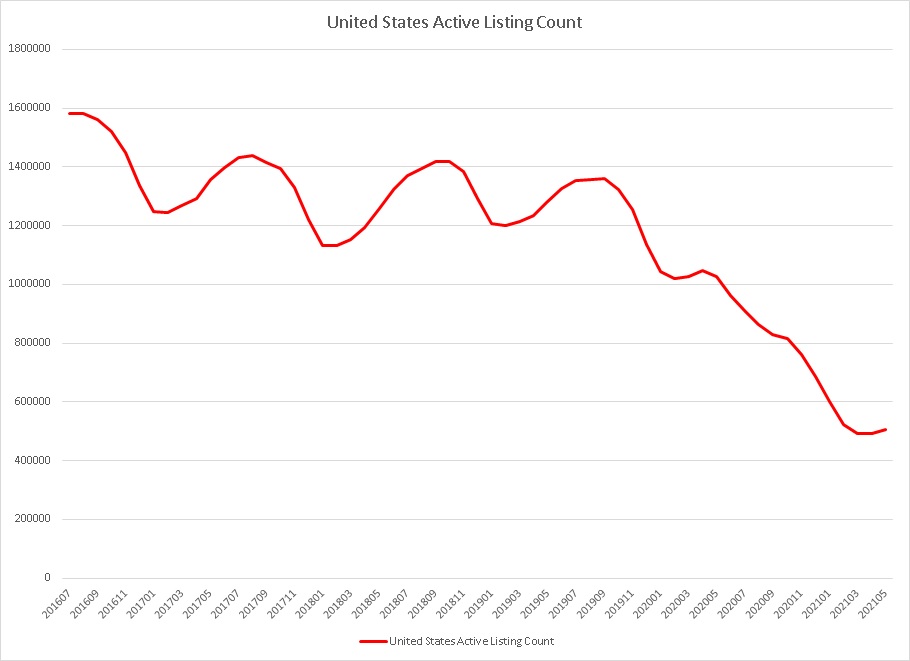
The graph shows the seasonality of the active listing count in the United States from Realtor.com, and that the decline of housing inventory began to accelerate in March 2020 — around the same time as the increased global spread of COVID-19.
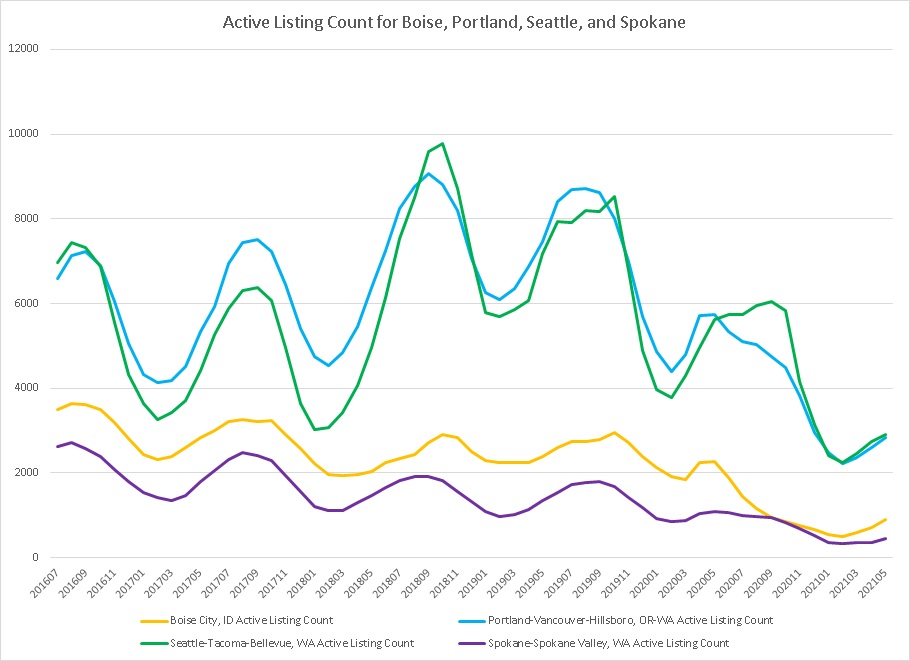
A closer look at the data by metro regions in which Washington Trust Bank primarily operates shows that this decrease in available listings is occurring locally as well. The active listing count by metro region has also declined when compared to the previous 4 year average. By metro region, active listings as of May 2021 were as follows:
The graph below illustrates the decrease in housing inventory for these metro regions during this same period of time.
Emily Badger and Quoctrung Bui made note of the decrease in homes available for sale and explored the issue earlier this year in an article for the New York Times entitled “Where Have All the Houses Gone?”![]() Reluctance to sell in a global pandemic, government policy restricting foreclosure on homes in forbearance, and a decrease in home building over time to meet demand were offered as explanations for the change. In the article, the writers noted that “when there aren’t a lot of options out there to buy, would-be sellers get skittish about finding their own next home and back out of the market themselves.” This behavior could explain the continued decline observed in housing inventory.
Reluctance to sell in a global pandemic, government policy restricting foreclosure on homes in forbearance, and a decrease in home building over time to meet demand were offered as explanations for the change. In the article, the writers noted that “when there aren’t a lot of options out there to buy, would-be sellers get skittish about finding their own next home and back out of the market themselves.” This behavior could explain the continued decline observed in housing inventory.
Prices have continued a very strong increase thus far in 2021. Last week, the S&P CoreLogic Case-Shiller U.S. National Home Price NSA Index reported a 13.2% annual gain in March ![]() . The demonstrated decrease in housing inventory is most assuredly providing further fuel to an already significantly heated housing market.
. The demonstrated decrease in housing inventory is most assuredly providing further fuel to an already significantly heated housing market.
Washington Trust Bank believes that the information used in this study was obtained from reliable sources, but we do not guarantee its accuracy. Neither the information nor any opinion expressed constitutes a solicitation for business or a recommendation of the purchase or sale of securities or commodities.
Nick is a Vice President and Portfolio Manager for Washington Trust Bank’s Wealth Management & Advisory Services. He offers our clients the expertise to analyze portfolios and unique assets to ensure that they are suitable for meeting our clients’ goals and needs. Nick partners with our Relationship Managers to provide continual analysis to ensure that these customized portfolio solutions maintain the balance between risk and growth in order to ensure continued success in meeting the clients’ goals.
![]() Links with this icon are leaving Washington Trust Bank's website. This link is provided as a courtesy. Washington Trust Bank does not endorse or control the content of third party websites.
Links with this icon are leaving Washington Trust Bank's website. This link is provided as a courtesy. Washington Trust Bank does not endorse or control the content of third party websites.
Home | Contact | Locations | Privacy Policy | Terms & Conditions | Safe Act Numbers | Posting Rules
Rates and fees subject to change. Entire contents: Copyright 2014 Washington Trust Bank. An Equal Opportunity Employer.


