
If you own a house or are looking to buy one, you have probably noticed that houses have become less affordable over the past few years. Today’s blog post will explore this topic to help you understand the dynamics at play that are causing this to occur.
The NAHB/Wells Fargo Housing Opportunity Index is a measure of the affordability of homes. It is defined as the percentage of homes sold in an area that would have been considered affordable for a family earning the median income, based on the median home price and standard mortgage underwriting criteria.
* The methodology for the calculation of this index is presented at the end of this blog post
Experience over the last ten years shows that home prices can be volatile. Using data available through the 3rd quarter of 2018, the graph below presents median home price data (from Core Logic), in thousands ($), and reflects at least one full market cycle. The data shows that median national home prices have exceeded the levels of the previous housing peak (fourth quarter of 2005), and that median home prices for all the regional markets in which Washington Trust Bank primarily operates have also exceeded the previous high levels.
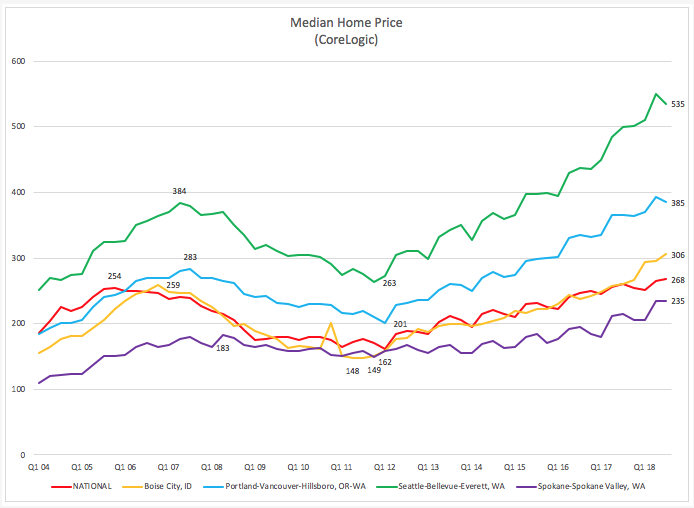
This graph shows Median Home Price (using data from CoreLogic) for the national average, Boise, Portland, Seattle, and Spokane from the 1st quarter of 2004 to the 3rd quarter of 2018.
Reviewing data on median family income (from the Department of Housing and Urban Development) shows that income, in thousands ($), does not seem to be very volatile when compared to home prices, and has risen steadily but slowly over time. One explanation for this lower volatility may be the sticky wage theory, which hypothesizes that pay of employees tends to have a slow response to the changes in the performance of a company or of the economy. The theory suggests that, when unemployment rises, the wages of workers remaining employed stay the same, or increase at a slower rate, rather than falling with the decrease in demand for labor. In other words, wages are said to be “sticky-down” and are less likely to decline during economic slowdowns, according to this theory.
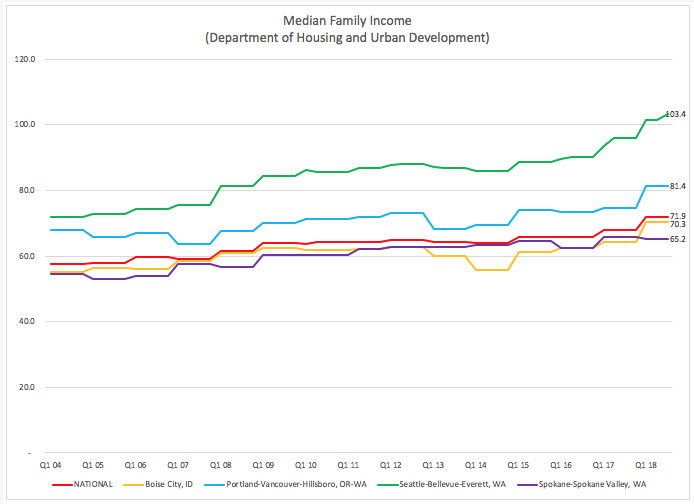
This graph shows Median Family Income (using data from the Department of Housing and Urban Development) for the national average, Boise, Portland, Seattle, and Spokane from the 1st quarter of 2004 to the 3rd quarter of 2018.
The graph below shows the Housing Opportunity Index, which combines the data for median home prices and median family income. Again, the NAHB/Wells Fargo Housing Opportunity Index is a measure of the affordability of homes. At the national and regional level, the data appear to show that housing opportunity index (affordability) could unfavorably decline further still (by as much as 16 percentage points nationally) to reach the lower affordability levels last seen in the in the third quarter of 2006.
Based upon the data presented in the graphs, affordability in Seattle, Portland and Boise have all declined over 45% from their peak affordability, while Spokane has only declined by 33%. Overall, wage growth has not kept pace with the rise in home prices in all markets, thus the drop in affordability. Spokane has benefited because its home prices have not grown as fast as Seattle, Portland or Boise. As such, Spokane’s affordability has outperformed these markets even though wages are also lower than the other regional markets.
Further declines in home price affordability seems uncertain given the extended length of the current economic recovery and tighter lending standards observed during the current housing cycle. Only time will tell.
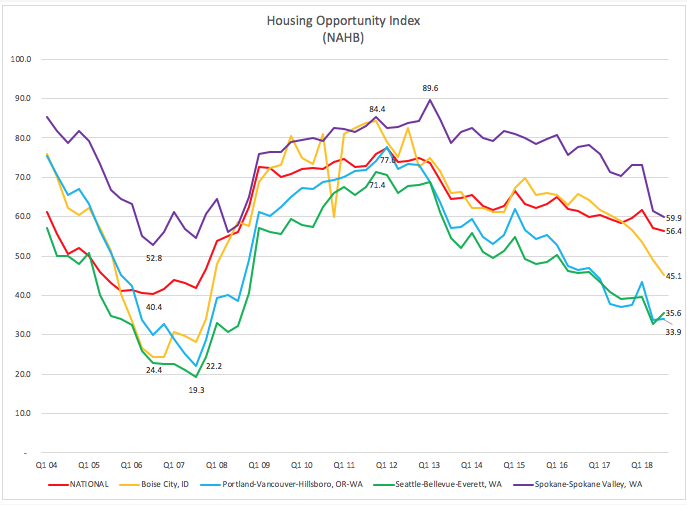
This graph shows the NAHB/Wells Fargo Housing Opportunity Index for the national average, Boise, Portland, Seattle, and Spokane from the 1st quarter of 2004 to the 3rd quarter of 2018.
* From the National Associate of Home Builders website![]() , the methodology of the index is as follows:
, the methodology of the index is as follows:
Washington Trust Bank believes that the information used in this study was obtained from reliable sources, but we do not guarantee its accuracy. Neither the information nor any opinion expressed constitutes a solicitation for business or a recommendation of the purchase or sale of securities or commodities.
Nick is a Vice President and Portfolio Manager for Washington Trust Bank’s Wealth Management & Advisory Services. He offers our clients the expertise to analyze portfolios and unique assets to ensure that they are suitable for meeting our clients’ goals and needs. Nick partners with our Relationship Managers to provide continual analysis to ensure that these customized portfolio solutions maintain the balance between risk and growth in order to ensure continued success in meeting the clients’ goals.
![]() Links with this icon are leaving Washington Trust Bank's website. This link is provided as a courtesy. Washington Trust Bank does not endorse or control the content of third party websites.
Links with this icon are leaving Washington Trust Bank's website. This link is provided as a courtesy. Washington Trust Bank does not endorse or control the content of third party websites.
Home | Contact | Locations | Privacy Policy | Terms & Conditions | Safe Act Numbers | Posting Rules
Rates and fees subject to change. Entire contents: Copyright 2014 Washington Trust Bank. An Equal Opportunity Employer.


